Energy Market Insights

Wholesale prices have fallen by 30% in the last 3 months, so it’s possible we could see even lower projections over the next few weeks. Although time will tell, as we sit outside of the relevant observation windows for some time yet.

Matt Turner-Tait
Manager
Energy Price Cap
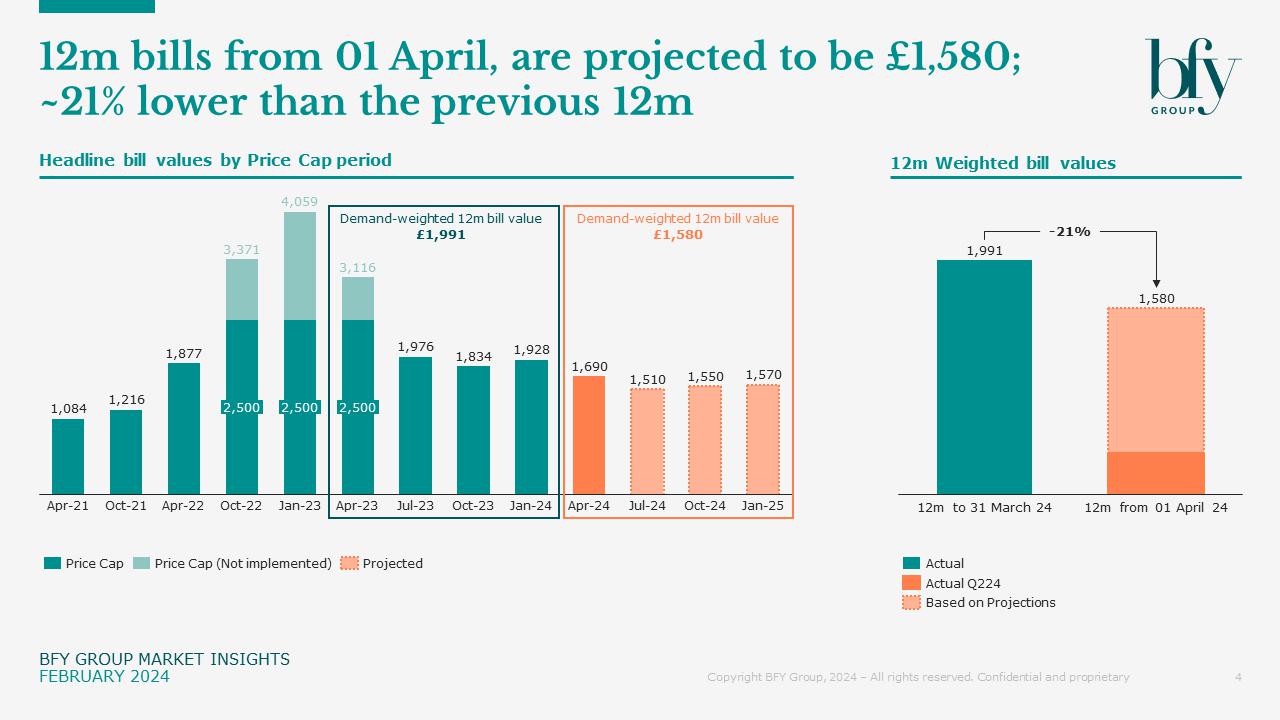
Price Cap at £1,690 – Welcome relief, and more competitive tariffs?
The Price Cap now stands at its lowest level since October 2021, after Ofgem announced April's headline cap will be £1,690 - settling slightly higher than our central case of £1,650 in December.
If wholesale costs remain steady, our analysis suggests:
- Price Caps will stay at or below their current level for the next 12 months
- Customers could expect to pay £1,580 in the 12m from 01 April
- This is a £411 (21%) fall compared to 12m to 31 March 24
Click 'Read more' to get the full insight.
The challenge for the market is clear: How do we learn from the last decade, and avoid boom and bust?

Ian Barker
Managing Partner
Energy Switching
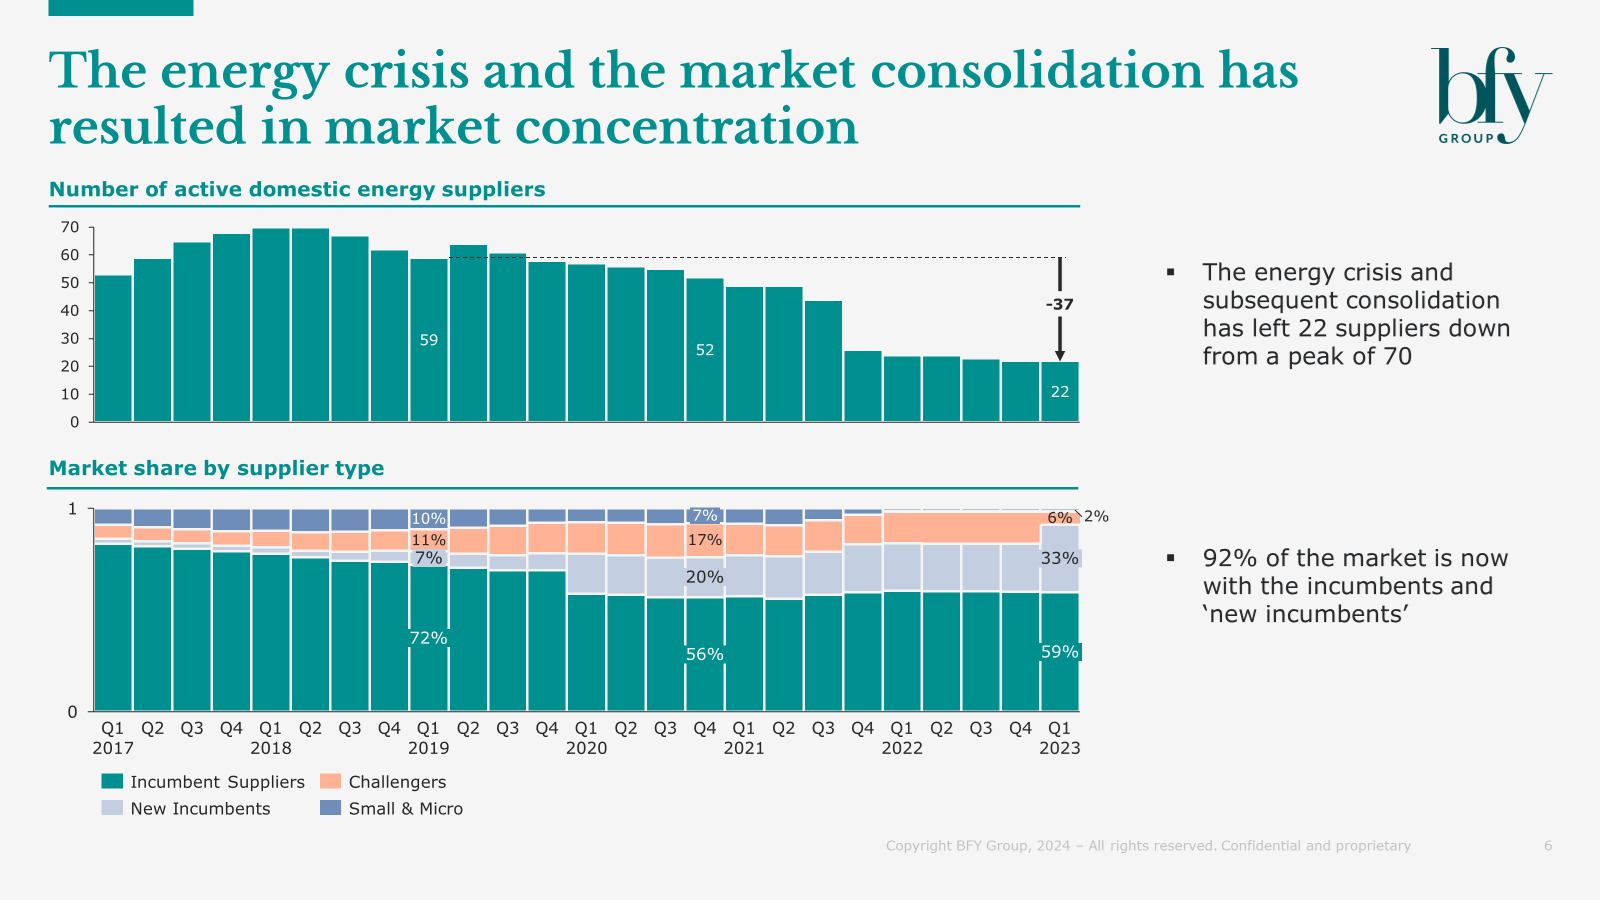
Are we seeing a return to the Big Six?
Six suppliers are dominating today's energy market - sounds familiar.
But what happens next?
Switching was previously driven by small/medium suppliers - with movement occurring from large to small/medium, or within the small/medium category. This was a result of price competition to grow market share, but today's market is different.
We're seeing very little price driven switching, with activity being driven largely by retention of existing customers, and direct sales via innovative offerings.
Click 'Read more' to get the full insight.
This is the quandary faced within the energy industry today: How do we help those who need energy, but are unable to pay?

Ian Barker
Managing Partner
Pre-payment Customers
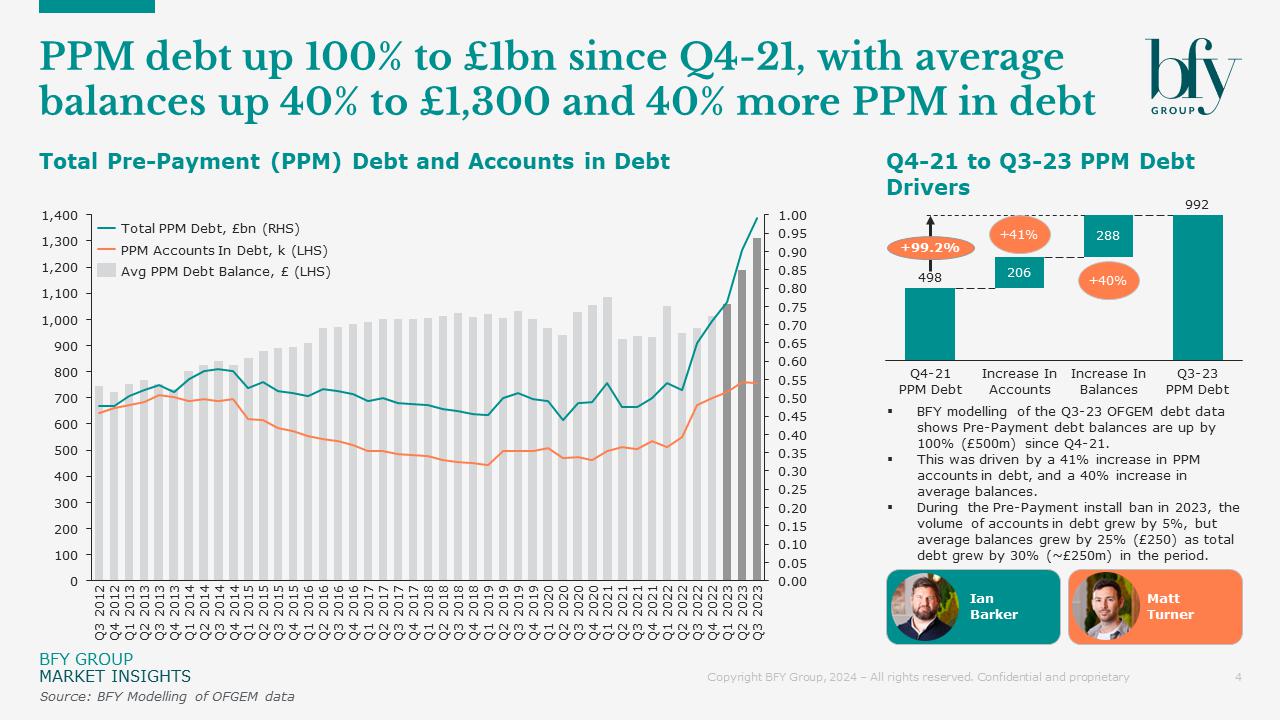
Pre-payment debt has increased 100% to £1bn since Q4-21
Over the past two years we’ve seen pre-payment meter (PPM) debts continuing to rise, and as of Q3-2023 they now stand at £1bn.
Our analysis shows:
- Pre-payment debt has increased by 100% to £1bn since Q4-21
- Number of PPM accounts in debt is up 40% to ~750k
- Average PPM balance has risen 40% to ~£1,300
We also saw a ~£850m increase in total energy debt in Q3-23, likely driven by customers falling into debt, or falling off formal arrangements.
Click 'Read more' to get the full insight.
There’s a ~18% (300k) reduction in accounts in debt with an arrangement to repay their debt – which could mean 300k customers had an arrangement but have not been able to maintain it.
Ian Barker
Managing Partner
Customer Debt
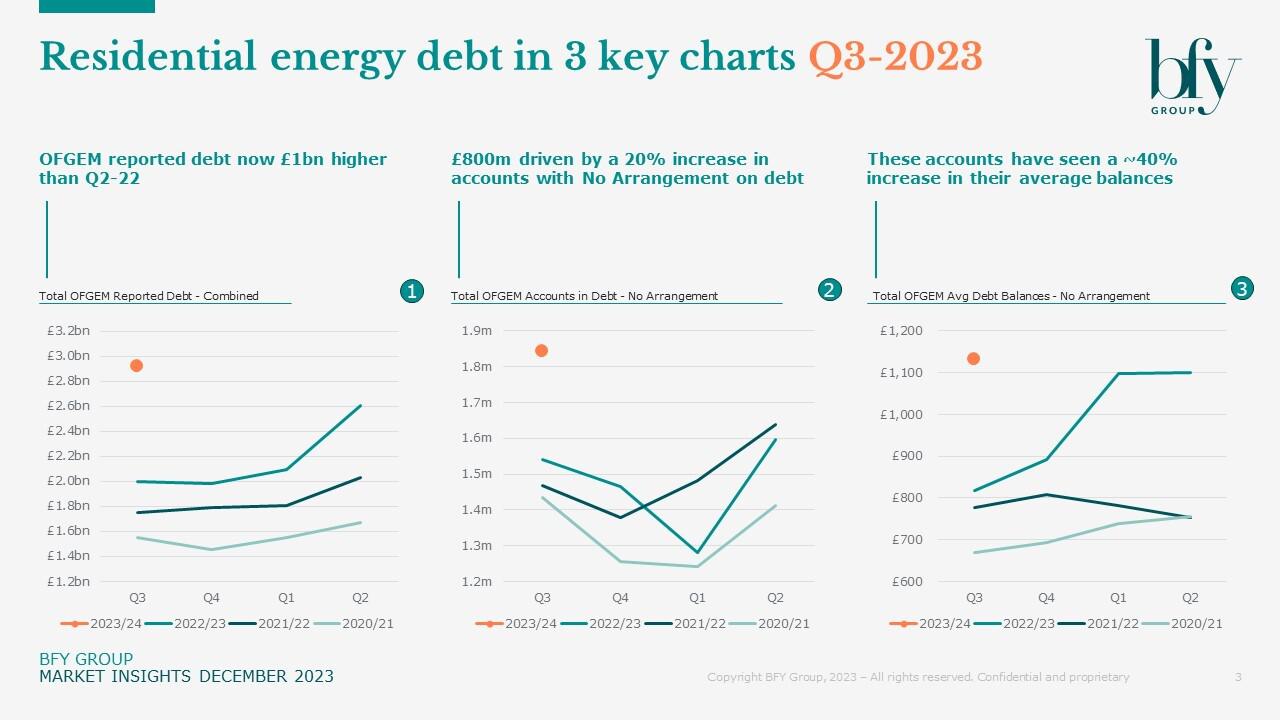
Total Ofgem reported debt is now at ~£3bn for Q3-2023
Total Ofgem reported debt is now at ~£3bn for Q3-2023, 50% (~£1bn) higher than Q3-2022.
The primary driver is an £800m increase from accounts with No Arrangement in place to repay their debt.
- We see a 20% (300k) increase in account numbers, which means more than 1.8m accounts are in debt without an arrangement.
- A 40% increase in balances per account to > £1,100.
As Ofgem reports this on an accounts basis, this means almost 1m households owe an average of £2,200 and have no arrangement in place to repay the debt with their supplier.
Click 'Read more' to get the full insight.
The nominal TDCV saving of ~2.5% - 5% has already been seen by customers, but if we have a cold winter (as some forecasters are predicting) then bills will rise further.
Matt Turner-Tait
Manager
Energy Price Cap
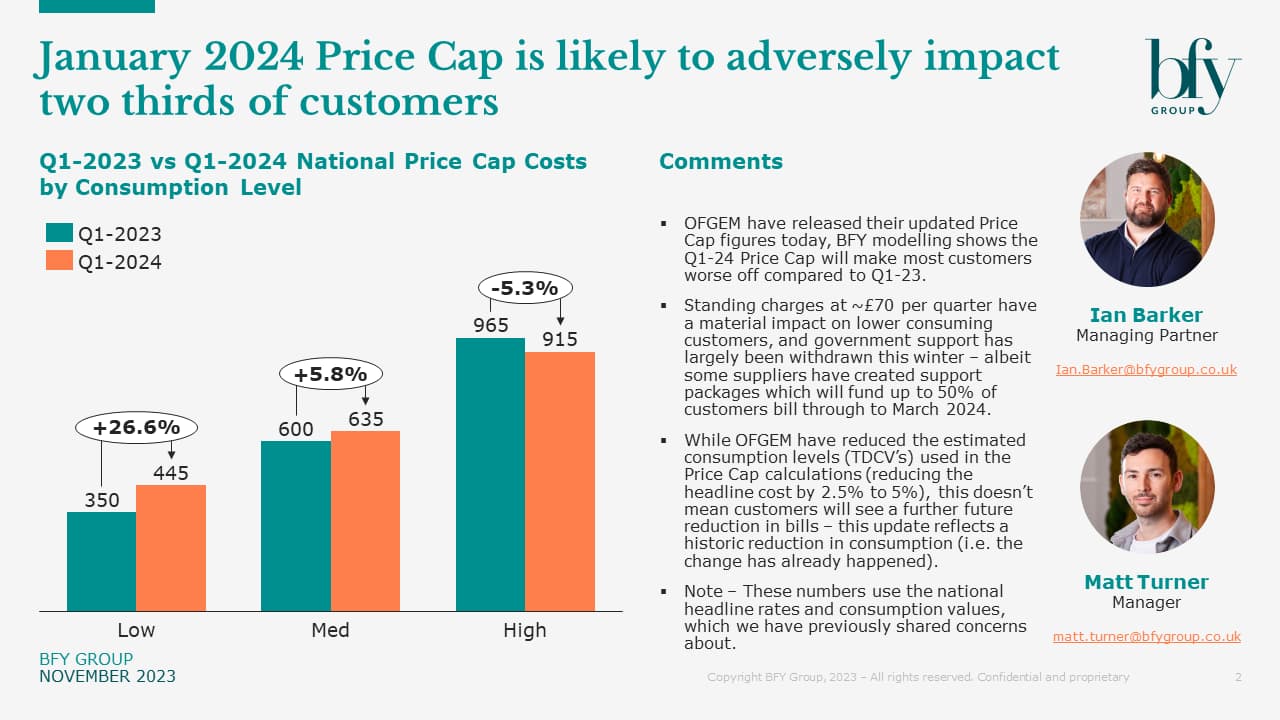
Most customers worse off due to Jan 2024 Energy Price Cap
OFGEM have released their updated Energy Price Cap figures for Q1-24, and our modelling shows this will make most customers worse off compared to Q1-23.
Analysis from the BFY Group team shows:
- Low consuming customers are likely to be ~27% worse off
- Medium consuming customers are likely to be ~6% worse off
- High consuming customers are likely to be ~5% worse off
OFGEM have reduced their estimated annual consumption (TDCV’s) - but this won’t result in a further saving for customers, as this is an updated reflection of historic consumption.
Click 'Read more' to get the full insight.
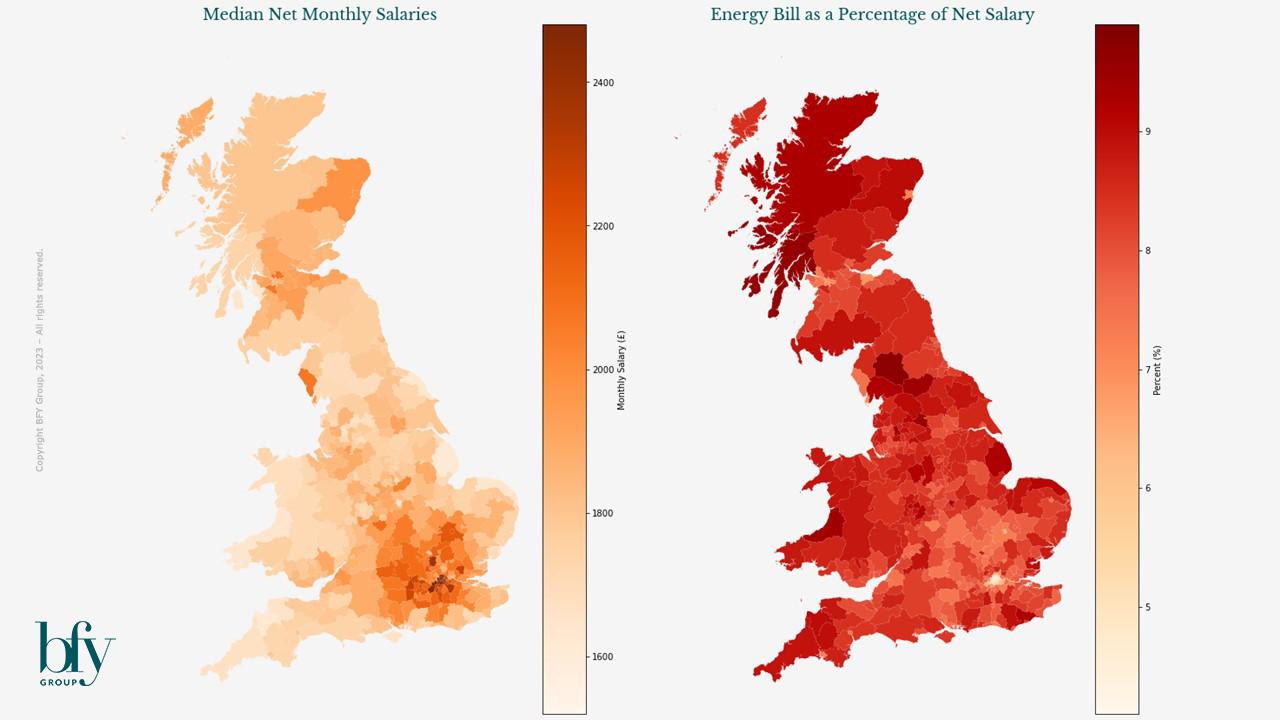
It’s evident that in some areas of the country, the proportion of earnings spent on energy is significantly larger than others, which poses an interesting question for suppliers. Could this information be better reflected in models for vulnerability and debt management?

John de Bono
Consultant
Energy Bills
Localised Energy Bills – How do they differ to the Price Cap?
Ofgem's Energy Price Cap - we're all familiar with the purpose of its headline figure (previously set at £1,834). But rarely do we discuss the reality of this estimation, and how it can't reflect the actual bills faced by households across the country.
The current approach is problematic. By using the national average for energy consumption, the headline figure ignores regional variations in usage and spend.
While finding a more effective approach is a much larger discussion, our latest analysis could help to inform this thinking, looking at typical local bills vs the Price Cap. This also poses a potential opportunity for suppliers to re-think models for vulnerability and debt management.
Click 'Read more' to get the full insight.
Our debt benchmarking suggests the full view of debt in the industry is 2.5x to 3.3x higher than currently reported. This likely means that the most challenged customers are excluded from the reporting.

Matt Turner-Tait
Senior Manager
Customer Debt
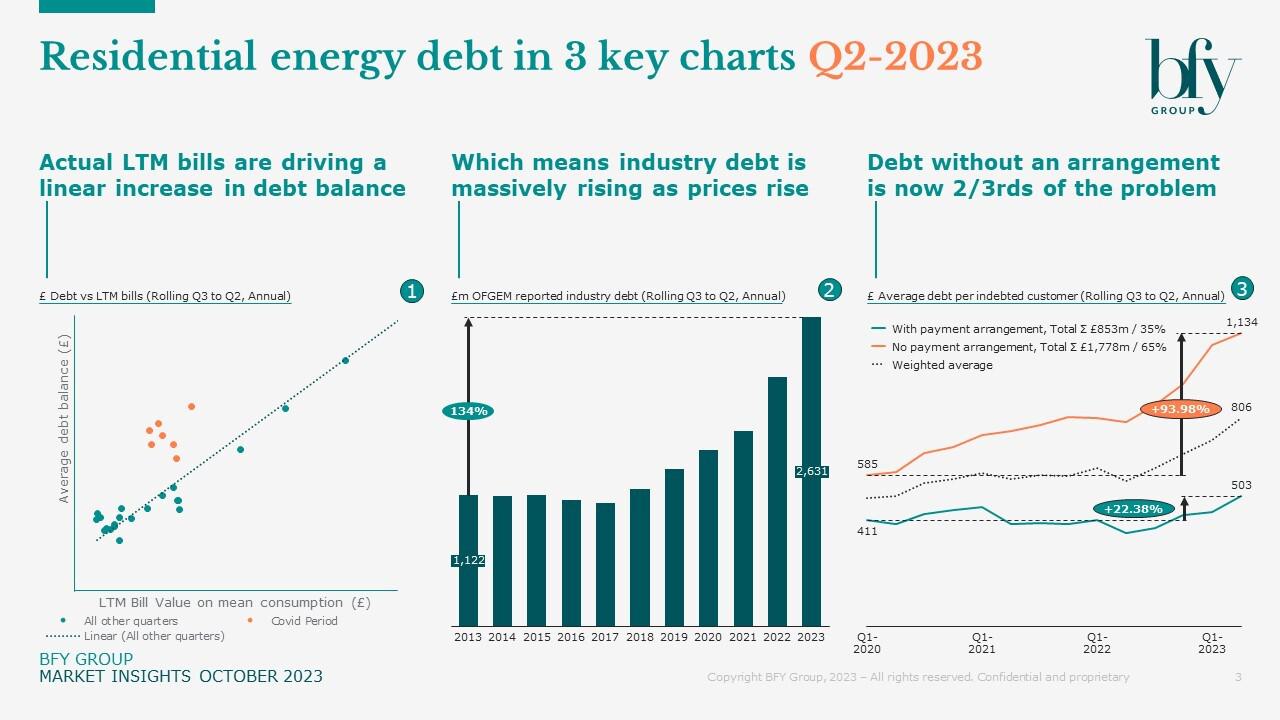
Customer indebtedness is set to worsen this winter
Customer indebtedness is growing at an unsustainable rate. And it’s projected to get worse as we head into winter.
Analysis from our Market Insights supports this, highlighting three key points, which we’ve explored further in this blog.
- The increase in actual bills over the Last Twelve Months (LTM) is unsurprisingly driving an increase in customer indebtedness
- So as prices rise, the industry as a whole falls more into debt
- Two thirds of this debt (>£1.1bn) relates to customers without an agreed repayment arrangement – and these customers are slipping further into debt
Click 'Read more' to get the full insight.
Prices while high, have started to stabilise. We’re seeing some suppliers now starting to offer fixed prices at a discount to the cap. What now needs to happen is a return to a functioning market. If a price cap is to be in existence, then it should serve a specific purpose.
Ian Barker
Managing Partner
Energy Price Cap
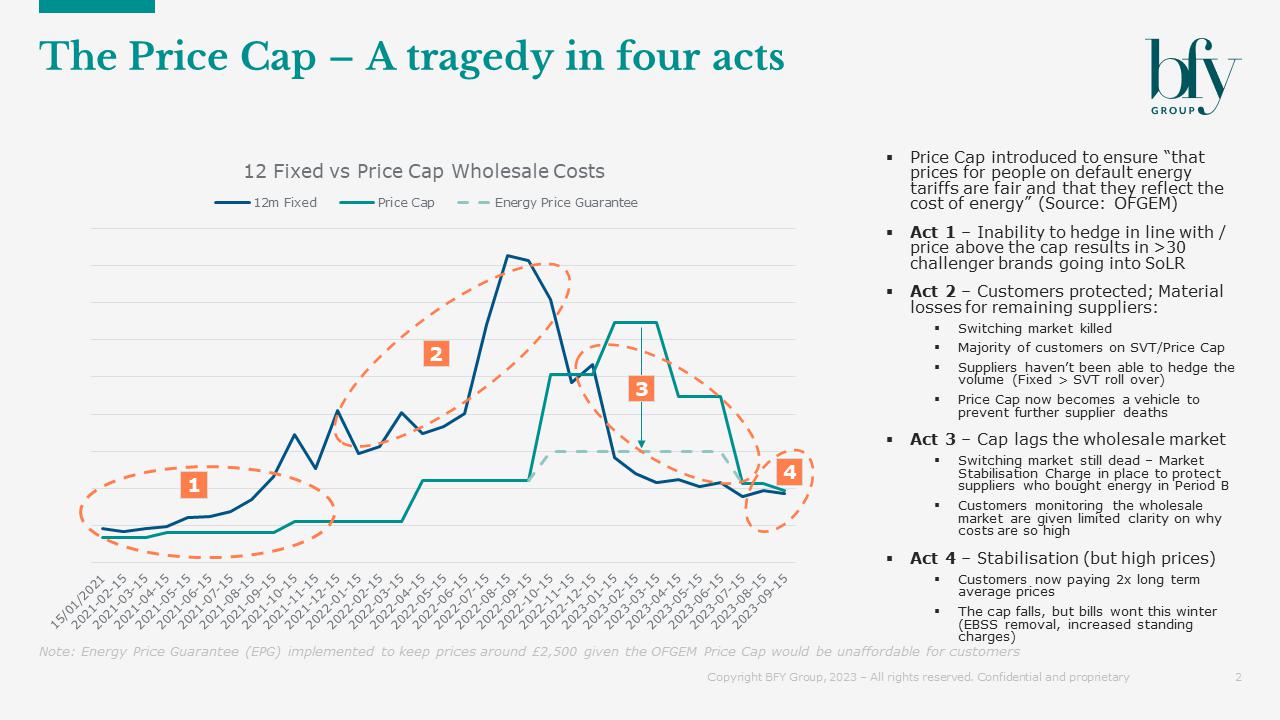
The Energy Price Cap – A tragedy in four acts
As we start to see acquisition tariffs which are below the level of the Price Cap, we've reviewed the potted history of the Price Cap over the past two years.
The blog post 'The Price Cap - A tragedy in four acts' walks through the detail in the chart on the right.
𝗔𝗰𝘁 𝟭 – Inability to hedge in line with / price above the cap results in around 30 challenger brands going into SoLR
𝗔𝗰𝘁 𝟮 – Customers protected; Material losses for remaining suppliers
𝗔𝗰𝘁 𝟯 – Cap lags the wholesale market
𝗔𝗰𝘁 𝟰 – Stabilisation (but high prices)
Click 'Read more' to get the full insight.

Debt repayment lengths appear challenging for a number of suppliers, and when the average repayment length for an energy debt is ~10 years, we have to ask "Is this really the best outcome for the customer?"
Matt Turner-Tait
Manager
Customer Debt
Market debt levels continue to rise with prices
Market debt levels have continued to rise as the the price cap rises - however we've also seen customers absorb a greater proportion of the price increases than expected. This isn't all good news - we're potentially starting to see a latent effect where customers are running out of options by which to cover the increased costs which will give rise to increased debt levels in Q4-23 / Q1-24.
The use of Pre-Payment meters for debt purposes has recently been a hot topic. As well as the need for customers to access electricity and gas, suppliers have a duty to customers to help prevent debt - in our Financial Services practice we see the FCA having specific Consumer Duty rules to act in good faith and deliver good customer outcomes - which includes preventing debt build up.
Benchmarking suppliers current approaches to Pre-Payment debt management shows a significant spread across suppliers and fuels.
Click 'Read more' to get the full insight.
Start a Conversation
Curious about how we can help? We're here when you're ready.

Ian Barker
Managing Partner
Ian shapes the BFY vision and inspires our team to bring it to life, while remaining central to complex client engagements in Strategy, Commercial, and Operations.
Matt Turner-Tait
Senior Manager
Matt lead clients through key strategic projects exploring growth opportunities, business models, competitive advantage, and mergers & acquisitions.

John de Bono
Consultant
John performs various analyses to provide BFY and their clients with unique insights, which help to inform decision making and inspire exceptional performance.
Subscribe today to receive the latest news and updates from BFY
By submitting my personal data, I consent to BFY collecting, processing, and storing my information in accordance with our Privacy Policy.